By default, only a small number of required Docker services are started to support basic development:
ENABLED_DOCKER_SERVICES="postgres mysql inbucket"
But there are many additional services ready to work with your local environment. Note that some services will require a Mattermost Enterprise license.
ENABLED_DOCKER_SERVICES="postgres mysql inbucket minio openldap dejavu keycloak elasticsearch grafana prometheus promtail loki"
To customize which services are started, either export the above environment variable or copy config.mk as config.override.mk to tune appropriately.
From https://www.postgresql.org/:
The official site for PostgreSQL, the world’s most advanced open source database.
This is the default and recommended database to use with Mattermost. No additional configuration should be required, but the following settings apply to a Mattermost instance using Postgres:
MM_SQLSETTINGS_DRIVERNAME=postgres
MM_SQLSETTINGS_DATASOURCE=postgres://mmuser:mostest@localhost:5432/mattermost_test?sslmode=disable\u0026connect_timeout=10
From https://dev.mysql.com/doc/refman/8.3/en/introduction.html:
The MySQL software delivers a very fast, multithreaded, multi-user, and robust SQL (Structured Query Language) database server.
This is an alternate database supported by Mattermost, but not recommended for new deployments.
To use with Mattermost, be sure to configure the following settings:
MM_SQLSETTINGS_DRIVERNAME=mysql
MM_SQLSETTINGS_DATASOURCE=mmuser:mostest@tcp(localhost:3306)/mattermost_test?charset=utf8mb4,utf8\u0026readTimeout=30s\u0026writeTimeout=30s
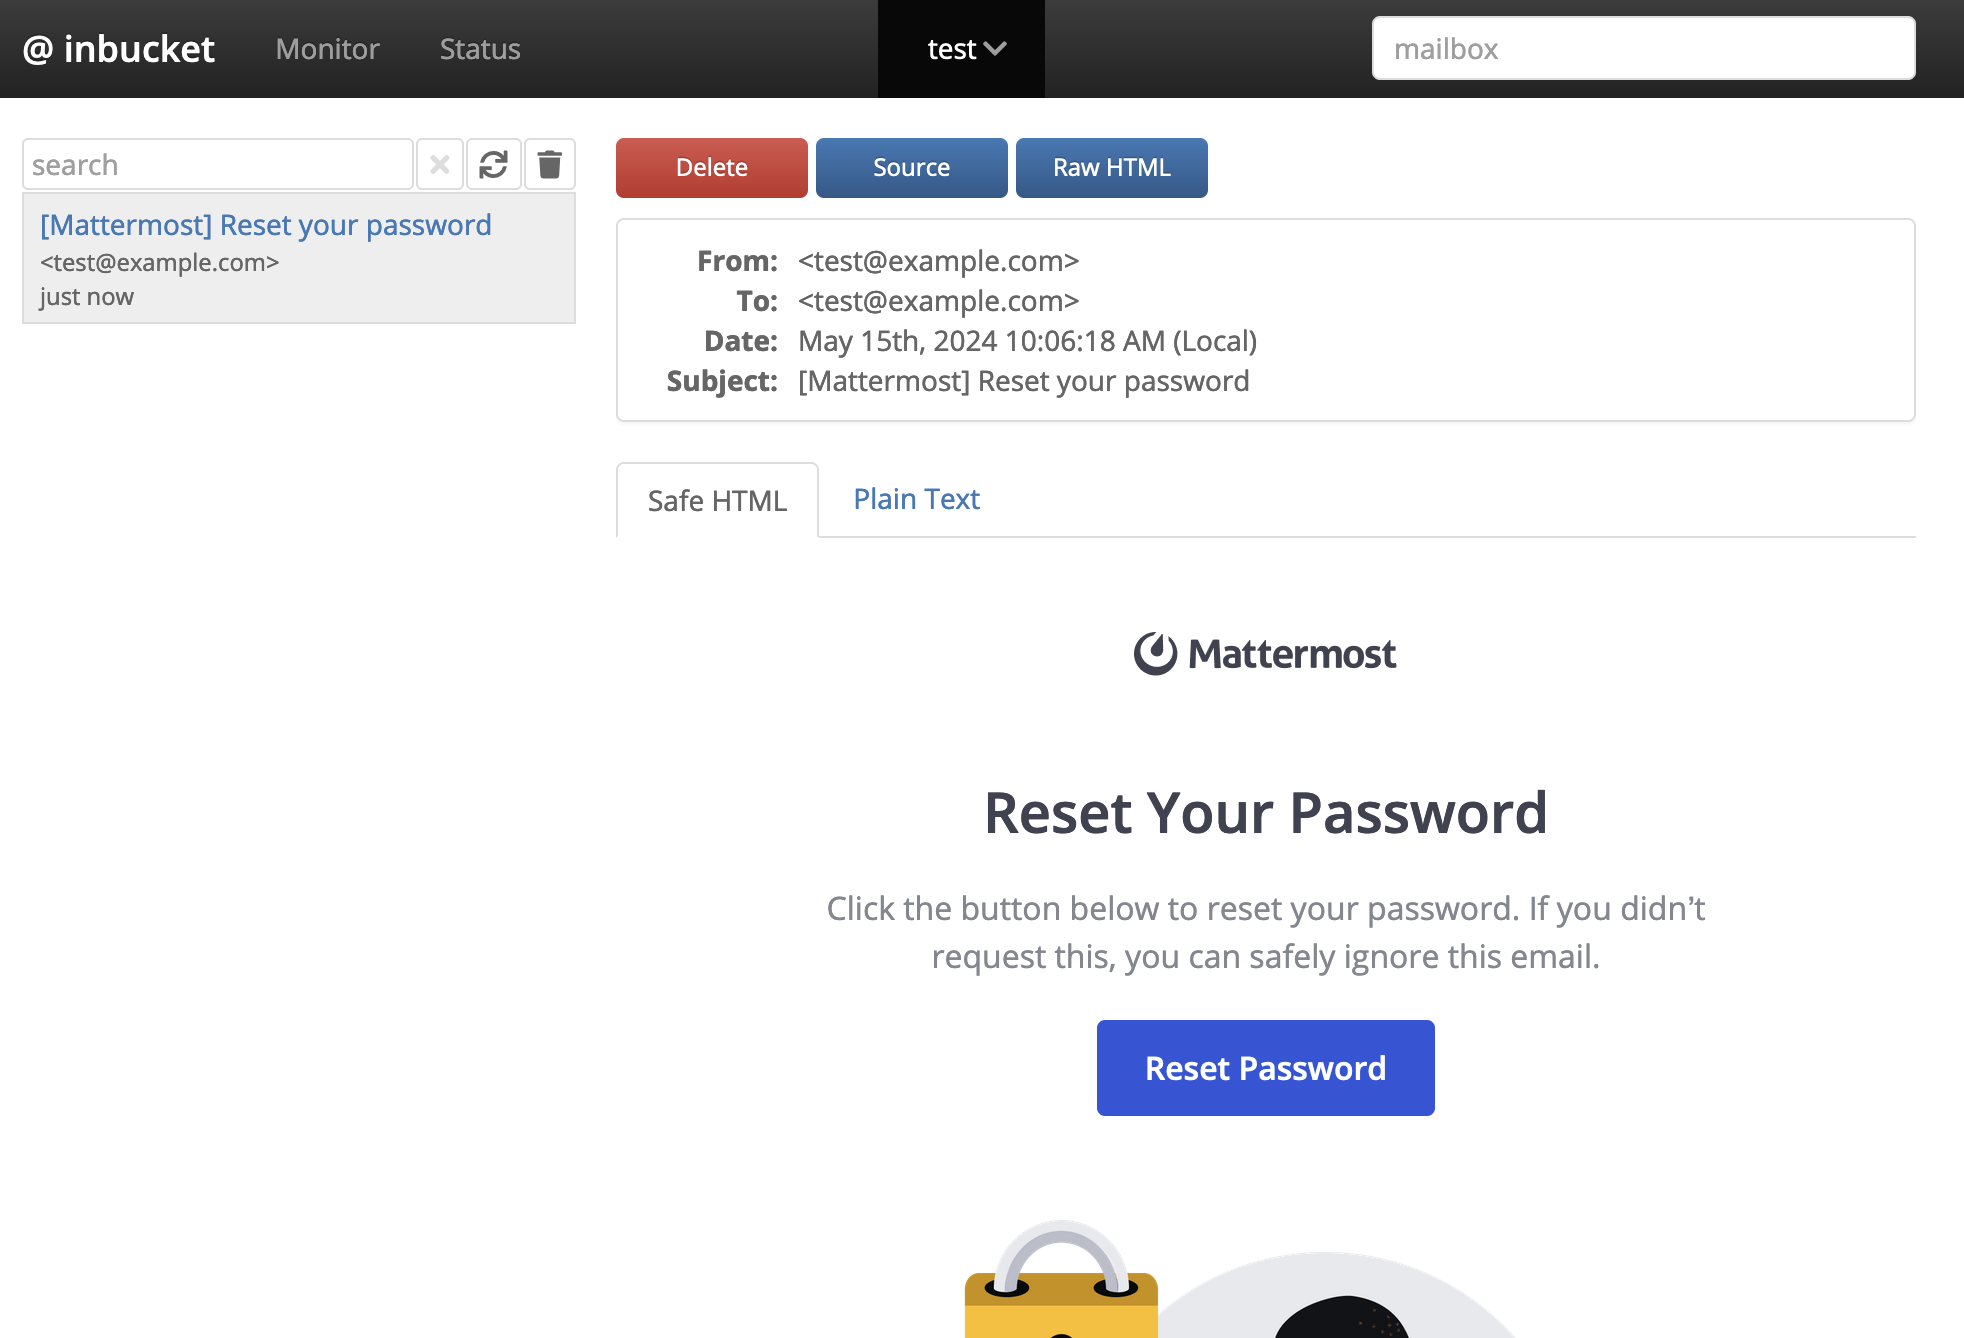
From https://inbucket.org/about/:
Inbucket is an email testing application; it will accept messages for any email address and make them available to view via a web interface. If you’ve ever used mailinator.com, you already have a good idea of what Inbucket does. The benefit of Inbucket is that it is an application instead of a hosted service; you may run it on your own private network, or even your desktop.
Use this during development to “receive” email confirmations, password resets, or message notifications.
To use with Mattermost, be sure to configure the following settings:
MM_EMAILSETTINGS_ENABLESMTPAUTH=false
MM_EMAILSETTINGS_SMTPUSERNAME=
MM_EMAILSETTINGS_SMTPPASSWORD=
MM_EMAILSETTINGS_SMTPSERVER=localhost
MM_EMAILSETTINGS_SMTPPORT=10025
When running, access the web interface at http://localhost:9001/.
From https://grafana.com/docs/
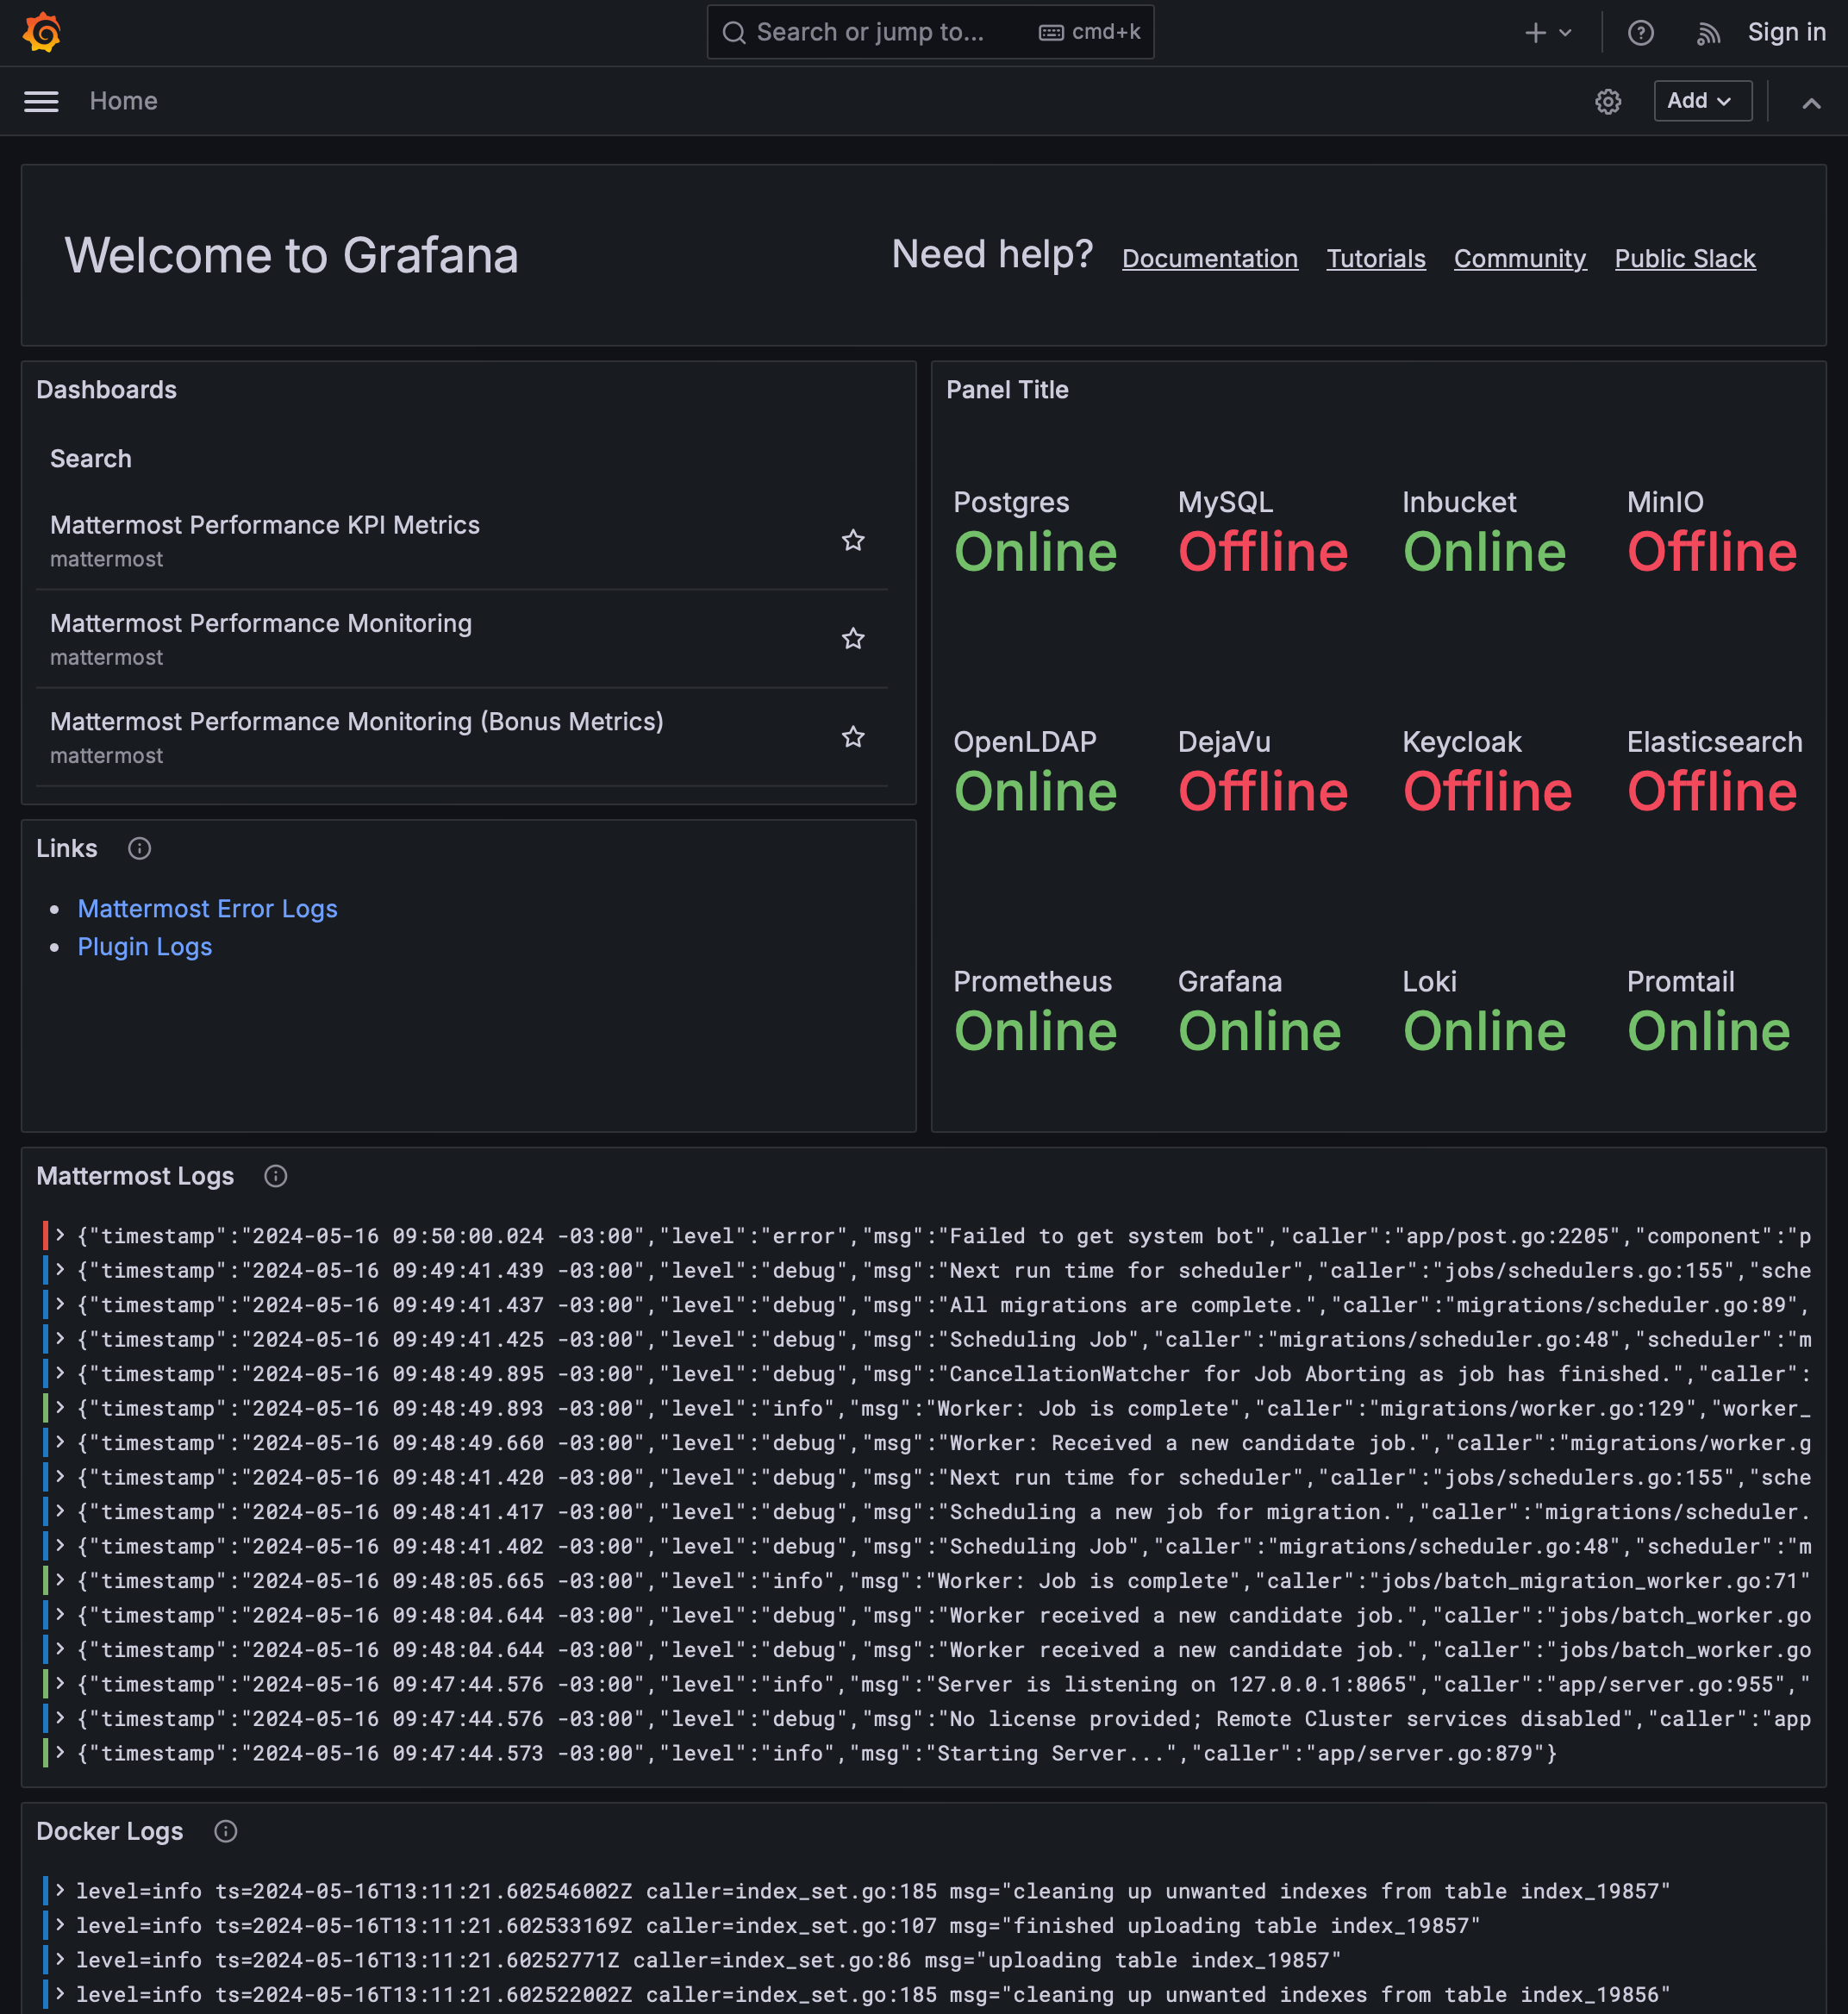
Collect, correlate, and visualize data with beautiful dashboards using our open source data visualization and monitoring solution.
Grafana is where all the metrics and logs collected by Prometheus, Loki and promtail come together. Panels visualize the data and are grouped into dashboards. The home dashboard links out to various performance dashboards, lists which Docker services are currently online, has quick links to various filtered log views, and panels showing the most recent Mattermost and Docker container logs.
When running, access the web interface at http://localhost:3000.
From https://prometheus.io/docs/introduction/overview/:
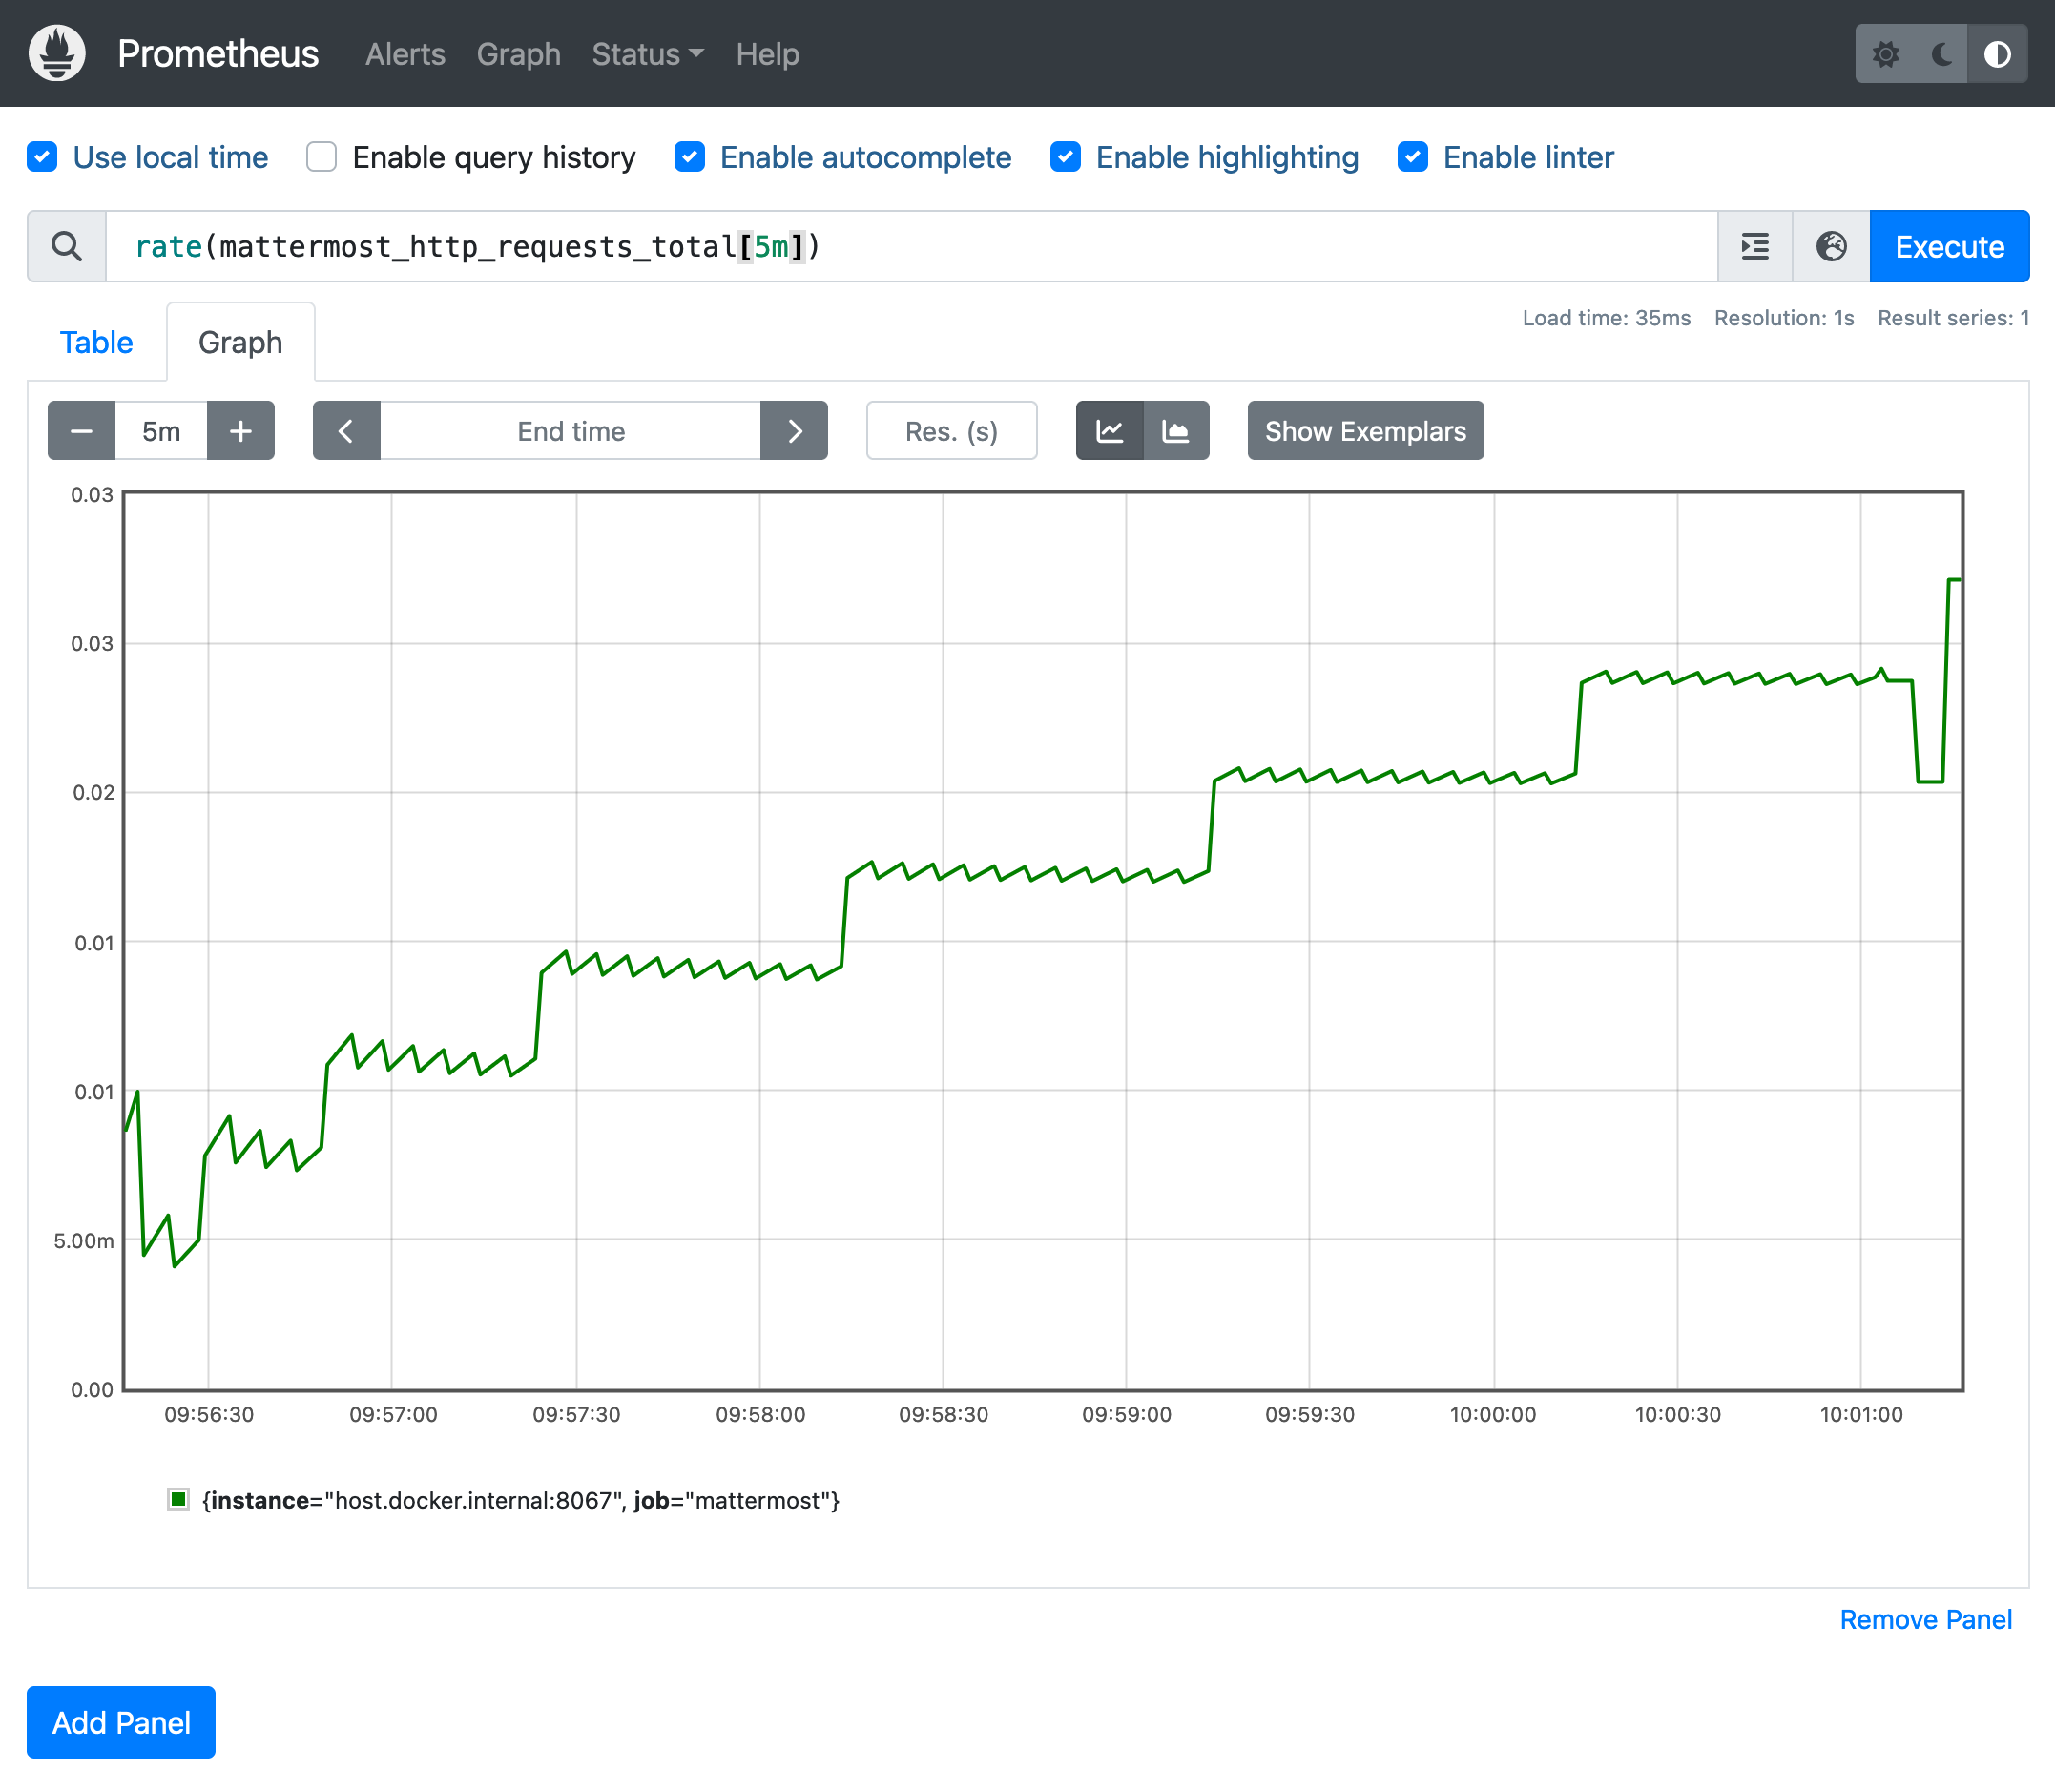
Prometheus collects and stores its metrics as time series data, i.e. metrics information is stored with the timestamp at which it was recorded, alongside optional key-value pairs called labels.
Mattermost exposes metrics at http://localhost:8067/metrics which are scraped periodically by Prometheus to form a time series database. While you can access Prometheus directly to view and graph this collected data, typically this is used in tandem with Grafana for a rich dashboard experience.
To use with Mattermost, be sure to install a Mattermost enterprise license and configure the following settings:
MM_METRICSSETTINGS_ENABLE=true
When running, access the web interface at http://localhost:9090/.
From https://grafana.com/docs/loki/latest/send-data/promtail/:
Promtail is an agent which ships the contents of local logs to a private Grafana Loki instance or Grafana Cloud. It is usually deployed to every machine that runs applications which need to be monitored.
To use with Mattermost, be sure to enable file logs, with the containing directory automatically mounted as a volume for promtail to scrape and relay to Loki. Promtail is automatically configured to scrape all Docker container logs for use with Loki and Grafana.
MM_LOGSETTINGS_ENABLEFILE=true
MM_LOGSETTINGS_FILELEVEL=debug
MM_LOGSETTINGS_FILEJSON=true
MM_LOGSETTINGS_FILELOCATION=logs
From https://grafana.com/oss/loki/:
Loki is a log aggregation system designed to store and query logs from all your applications and infrastructure.
Just as Prometheus is for metrics, think of Loki being for logs. Combined with promtail scraping the logs from Mattermost and all these supporting Docker containers, and Grafana for the frontend, Loki effectively provides a powerful user interface for slicing and dicing your developer logs.
From https://www.keycloak.org/documentation:
Keycloak is an open source identity and access management solution.
Keycloak can be used as a SAML identity provider with your local setup. See the setup instructions here.
Other Docker services supported by the development environment include: