Have you ever wondered how many active users your application can handle at the same time? If so, you’re not alone. Here at Mattermost we’re building a highly concurrent messaging platform for team collaboration that needs to potentially serve up to several thousands of users simultaneously.
While standard functional testing (e.g. unit tests) is critical to verify correct behavior of your application, it’s usually not sufficient to guarantee its performance at scale. This is where some form of performance testing can be particularly useful. Benchmarks do a good job at measuring the performance impact of single functions or limited portions of a codebase, but they can’t capture how an application is going to perform as a whole under real-world conditions. To achieve this you need load testing.
Load testing is the process of applying a certain amount of load to a target system in order to understand how it behaves. The more realistic the generated load is, the more accurate and insightful the final results will be.
Load testing can be used to improve both the performance and the overall quality of your application by helping you to:
As an example, these are some of non-performance related, but rather significant issues we’ve been able to detect while load testing:
As you can see, running load tests can guard your software against problems of different nature. By simulating users you get a chance to realistically test a system before it hits production and potentially avoid several issues down the line.
There are plenty of high quality load testing frameworks available; some of the best are free and open source (JMeter, Gatling, k6 to name a few). In our case, after a thorough examination, we decided to develop a custom, in-house tool. We accepted trading implementation time and complexity for improved simulation and finer control over the entire process. We’ve recently released version 1.0 and we’re quite happy with the choice we made. While the tool itself is not designed for general purpose use, it can still serve as a good example of how we tackled the problem of designing and developing a custom load testing engine.
As the definition says, the core of the process is load generation. It’s important to note that, similarly to what happens in other tools of this kind, the load will be generated at the HTTP (and Websocket) level through a series of API calls. This means that, from a performance perspective, we’re going to be testing everything in between the user (client) and the physical machine running our target application (server). Furthermore, in order for results to be meaningful, we need the software to mimic actual user behavior. We achieve this by leveraging data coming from real users through the use of:
Fortunately, here at Mattermost we have a convenient advantage: we use our own application in our day-to-day work. This means we’re able to continuously collect a considerable amount of realistic metrics from our community servers. We can then use such data to model user behavior. To do this we create a table of a user’s actions with their respective frequencies. This action-frequency map will feed the simulation process: a simulated user will randomly pick and perform an action based on its frequency so that the most common actions will be picked more often.

In such an example, the chance of a user switching a channel will be double the chance of creating a new post and four times that of replying to a thread.
Now that we have a simulation in place, we come back to the original question of this blog post: how can we make our load testing software tell us how many concurrently active users our target application can support?
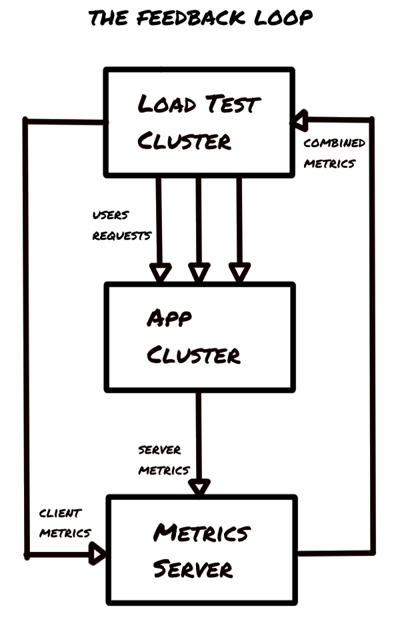
Instead of relying on magic formulas which are hard to explain (and sometime defend) or on endless and error-prone manual testing, we thought of picking an idea out of control theory that could give us both automation and precision at the same time: it’s called a feedback loop.

The idea is quite simple: have the load testing engine react to what’s happening on the target system by dynamically changing the amount of load applied in response to some event. This is achieved through the monitoring of those metrics that can best signal service degradation. Some that we make use of are:

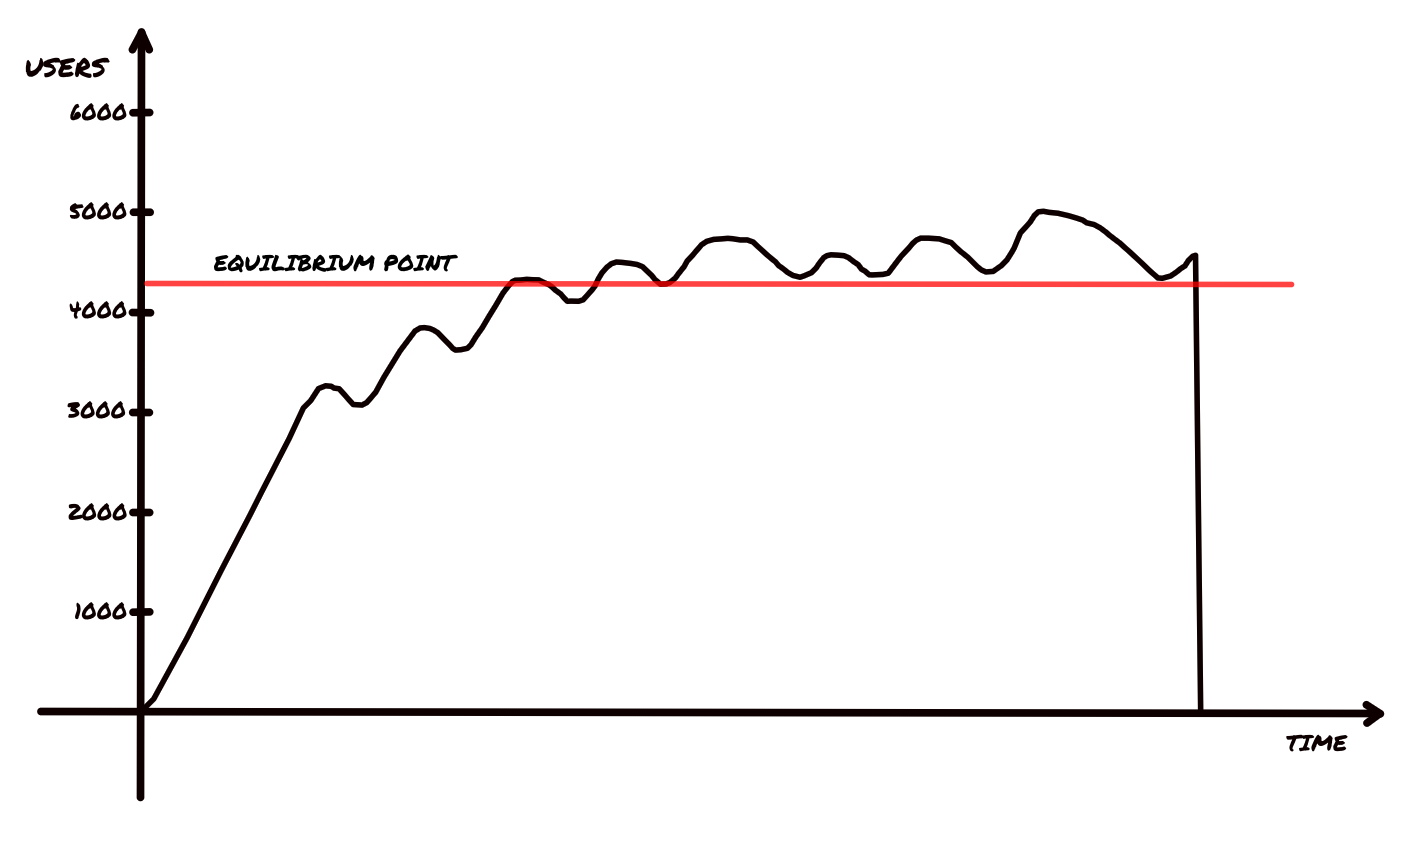
The load testing software constantly increases the number of active users up until it detects signs of performance degradation. This happens when the metrics being monitored reach their configured thresholds (e.g. 100ms for average request duration). In response to such an event, the load testing engine starts to lower the number of users. This process continues for a while until an equilibrium point is reached. This value, over which performance starts to degrade, gives us a fairly good estimate on the user capacity our target application can comfortably support.
The success of a software system greatly depends on its performance, especially in today’s cloud-oriented world. A small outage can have a serious impact on your customers and eventually affect your company’s revenue, especially when a service level agreement is in place.
Load testing is a precious tool that can help your team to improve both the overall quality and stability of your system by preventing performance issues and application bugs while improving scalability and minimizing the risk of down times.
Stay tuned for a follow-up article including an in depth technical discussion on the internals of our custom engine plus a full section on how to interpret and leverage load testing results. If you’d like to know more about this particular topic or discuss performance in general, you can reach us in the Developers: Performance channel.