Our Makefile entrypoint for developing against the Mattermost Server already tries to simplify things for developers as much as possible.
For example, when invoking make run-server, this build tooling takes care of all of the following (among other things!):
mmctl for API-driven command line interaction.mysql and postgres, both for a backend to the server and also to automate tests.inbucket to simplify email testing without routing outside your machine.minio to expose an S3-compatible interface to your local disk for hosting uploaded filesopenldap to simplify testing alternate modes of authentication (requires access to the enterprise source).elasticsearch to expose an improved search backend for posts and channels (requires access to the Enterprise source code).mattermost-webapp directory.RUN_SERVER_IN_BACKGROUND is false.logrus decorator for easier reading.go compiler to run the server code in your local repository.As of https://github.com/mattermost/mattermost/pull/16649, this build tooling now supports automating the setup of Prometheus and Grafana Docker containers. Together, these tools form the backbone of our Performance Monitoring (E20) functionality, scraping metrics from Mattermost to help give enterprise customers insight into the performance of their clusters. Automating this setup makes it easier for developers to test in a production-like environment, to help extend the monitoring available to customers, and even to run our certain kinds of loadtests using our loadtesting framework.
Since the corresponding Mattermost functionality is only available with access to the Enterprise source code, these containers aren’t enabled by default. To turn them on, export the following environment variable into your shell:
export ENABLED_DOCKER_SERVICES="mysql postgres inbucket prometheus grafana"
Alternatively, you can follow the instructions in config.mk. Note that it’s not necessary to specify minio, openldap, or elasticsearch - these are added automatically when an Enterprise-enabled repository is detected.
The build tooling does more than just spin up two new containers, however. Various configuration files also automate the following:
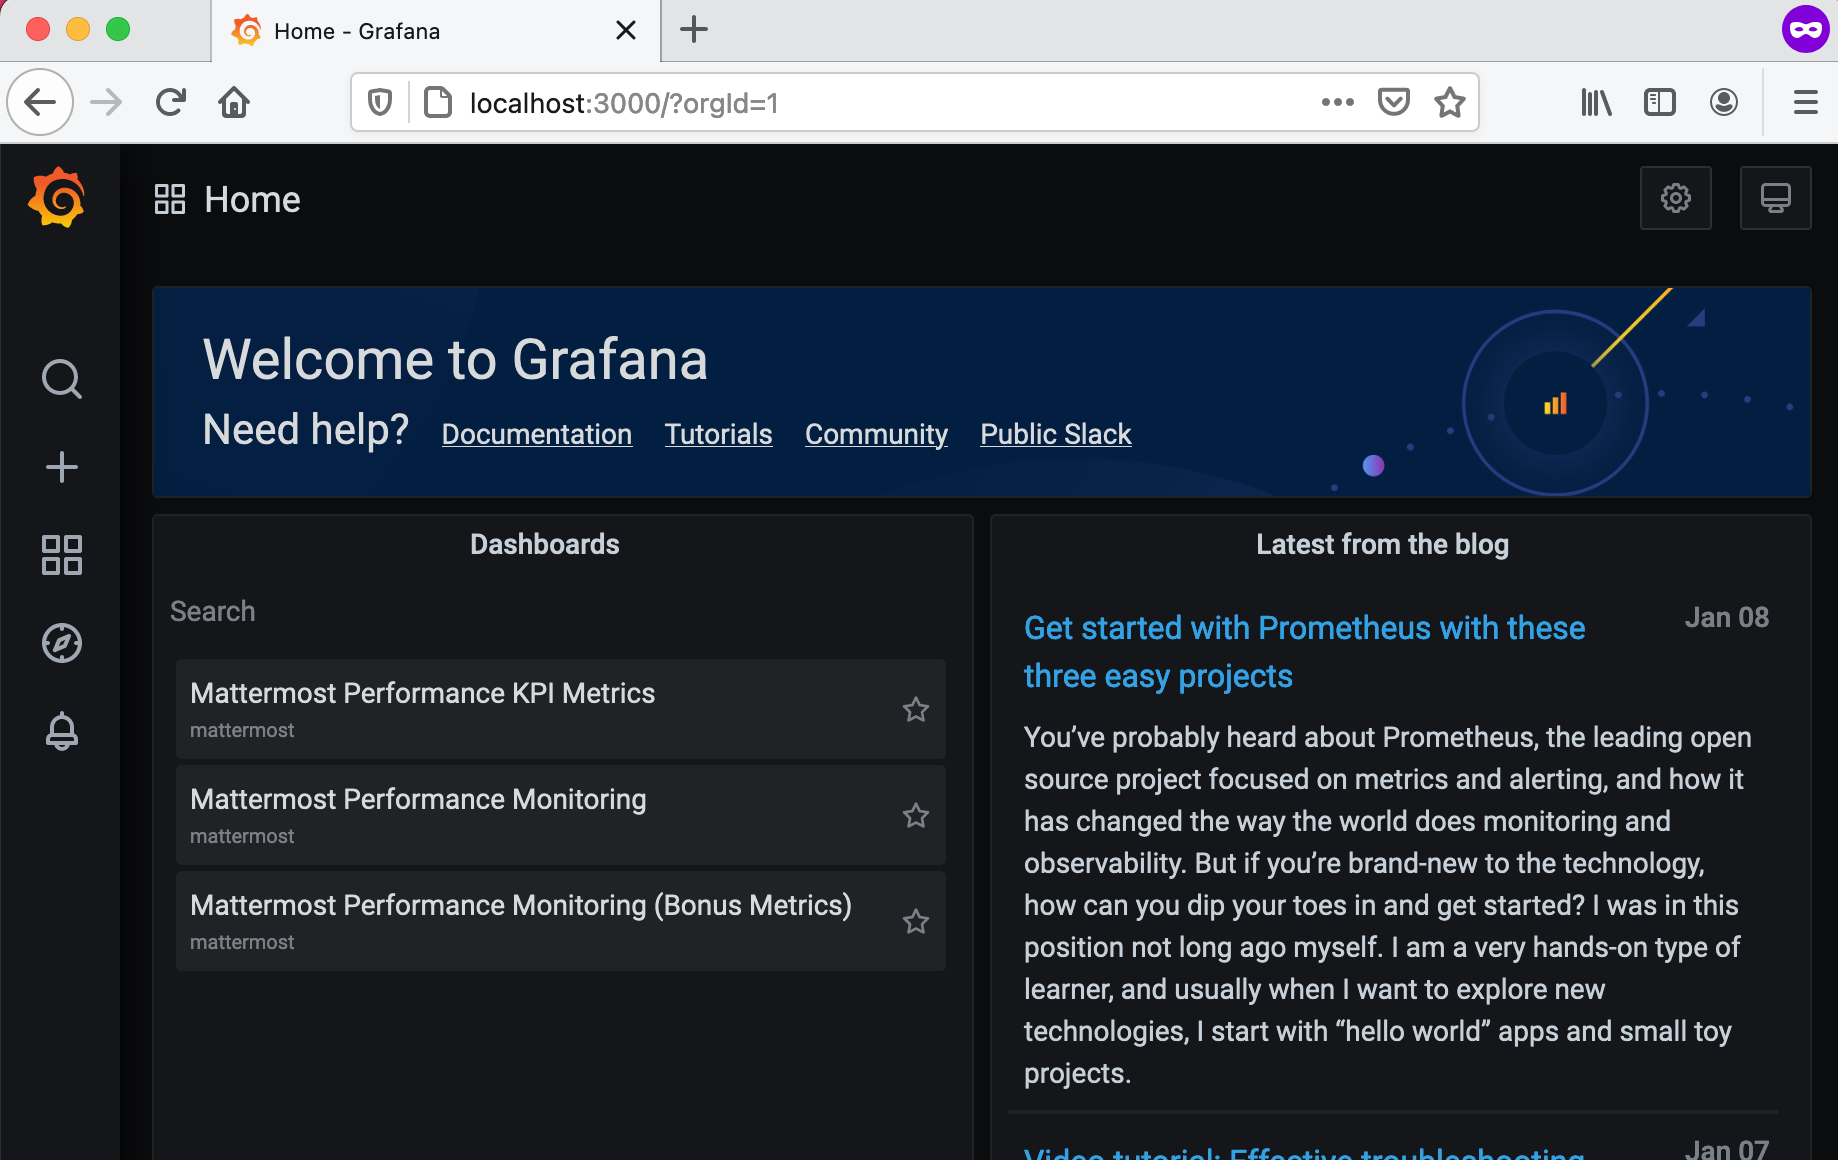
:8067/metrics endpoint (requires access to the Enterprise source code).admin/admin credentials if needed).This means that simply running make run-server gets you immediate access to the Mattermost Performance dashboards at http://localhost:3000:
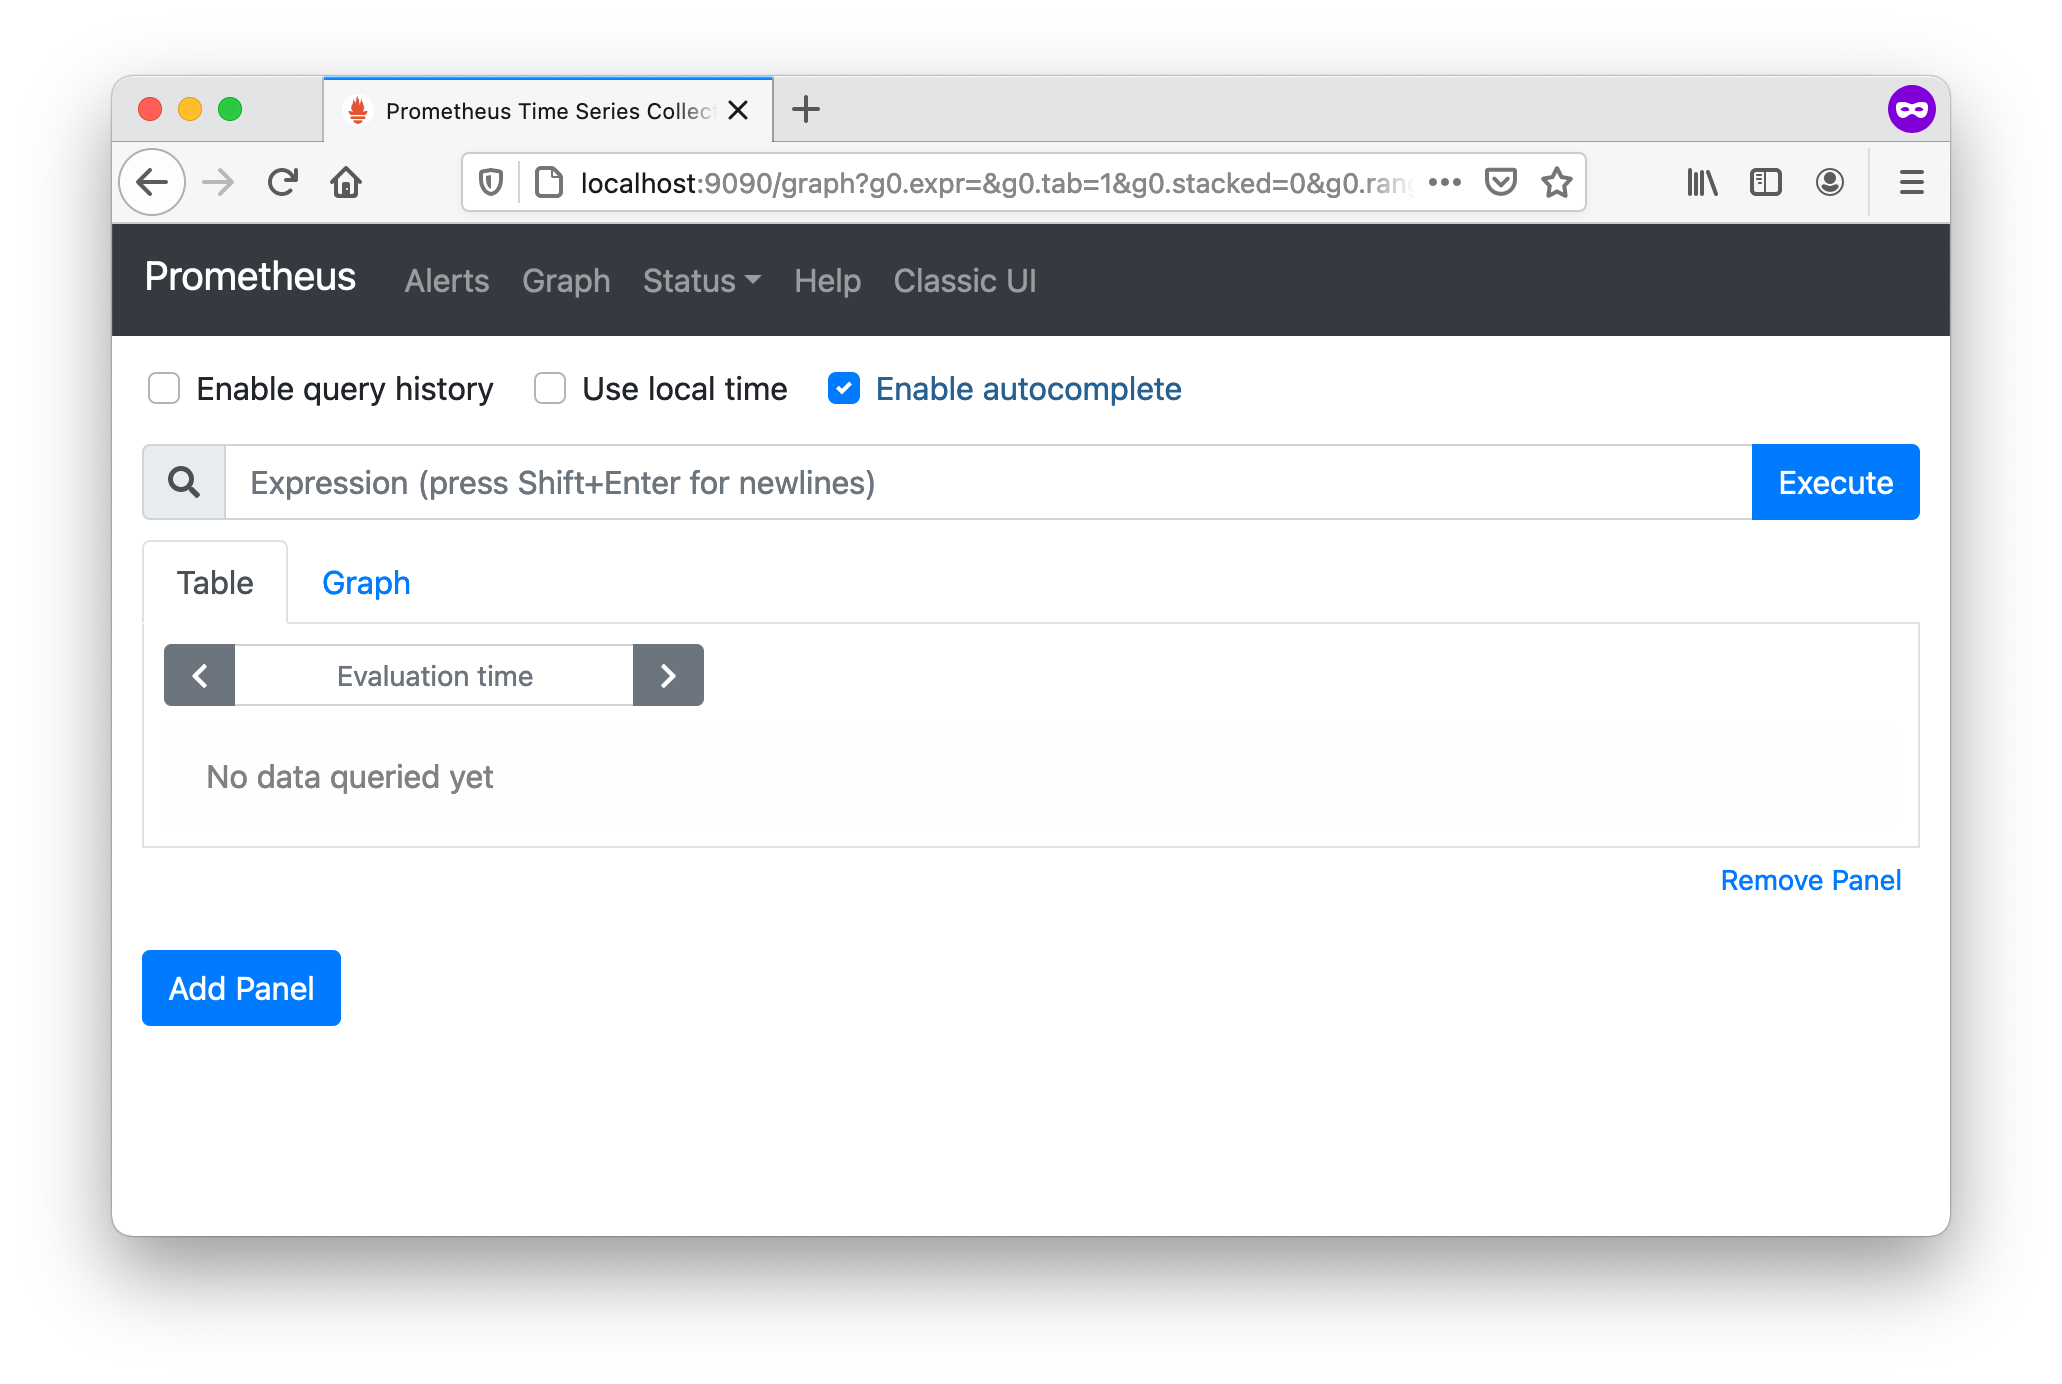
Prometheus is also available at http://localhost:9090:
Although the tooling is all set up to scrape metrics and display the dashboards, you’ll need to do some one-time work to enable metrics within the Mattermost server.
First, be sure you have an Enterprise license installed. Staff members should have access to the shared developer license, but you can also request a trial license in-product. Browse to /admin_console/about/license on your local Mattermost instance to set up the license.
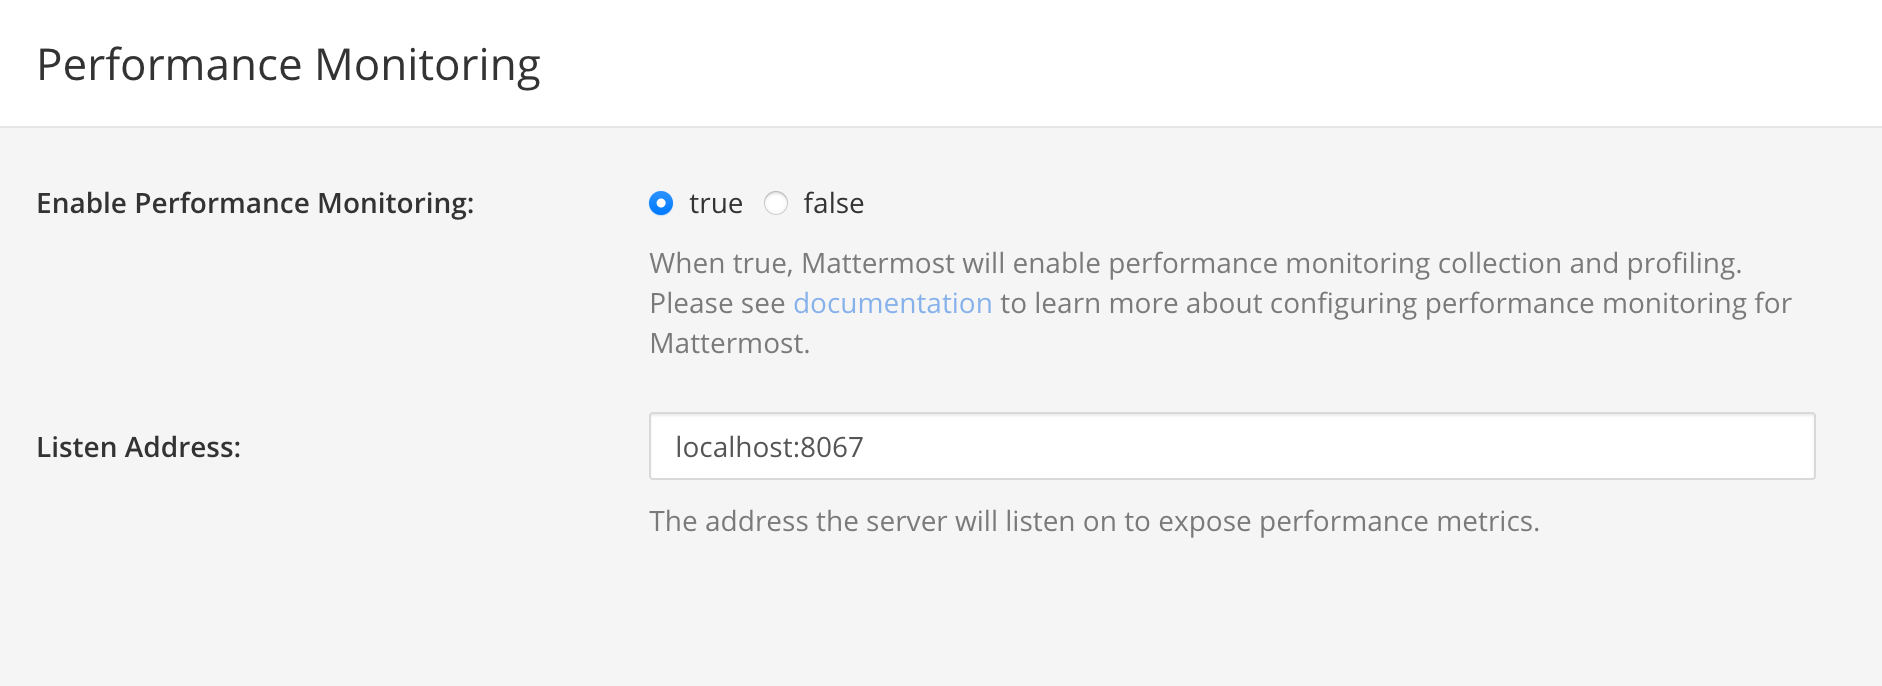
Second, enable performance monitoring. You can do this manually via config.json and setting MetricsSettings.Enable to true, or by exporting MM_METRICSSETTINGS_ENABLE=true into your shell before starting the server, or by enabling this manually via the System Console at /admin_console/environment/performance_monitoring:
These changes weren’t just made in isolation - in fact, this is all just infrastructure work for another recent project to improve Mattermost performance monitoring. Stay tuned for a follow-up blog post!